What Is Data Reconciliation, and How Does It Work in Practice?

Updated · Published
Data reconciliation is the process of comparing two sets of data that ought to agree, finding where they do not, and resolving the difference. Three quite different jobs share the name: financial reconciliation between ledgers and statements, pipeline reconciliation after data has been moved or migrated, and master data reconciliation across duplicate records. They fail for different reasons and are fixed by different people, which is why reconciliation conversations stall when two people mean different ones. And the breaks that keep arriving every month are almost never technical.
What is Data Reconciliation?
Data reconciliation is the practice of comparing data from different systems or sources to ensure consistency and accuracy. This process is essential for maintaining data integrity, as it helps identify and correct discrepancies across datasets. Data reconciliation serves as a quality checkpoint, ensuring that downstream analytics, reporting, and decision-making rely on consistent, reliable data.
The reason it exists is unglamorous. The same fact gets recorded in more than one place, those places disagree, and somebody has to establish which version to act on before a decision, a payment, or a regulatory report depends on it.
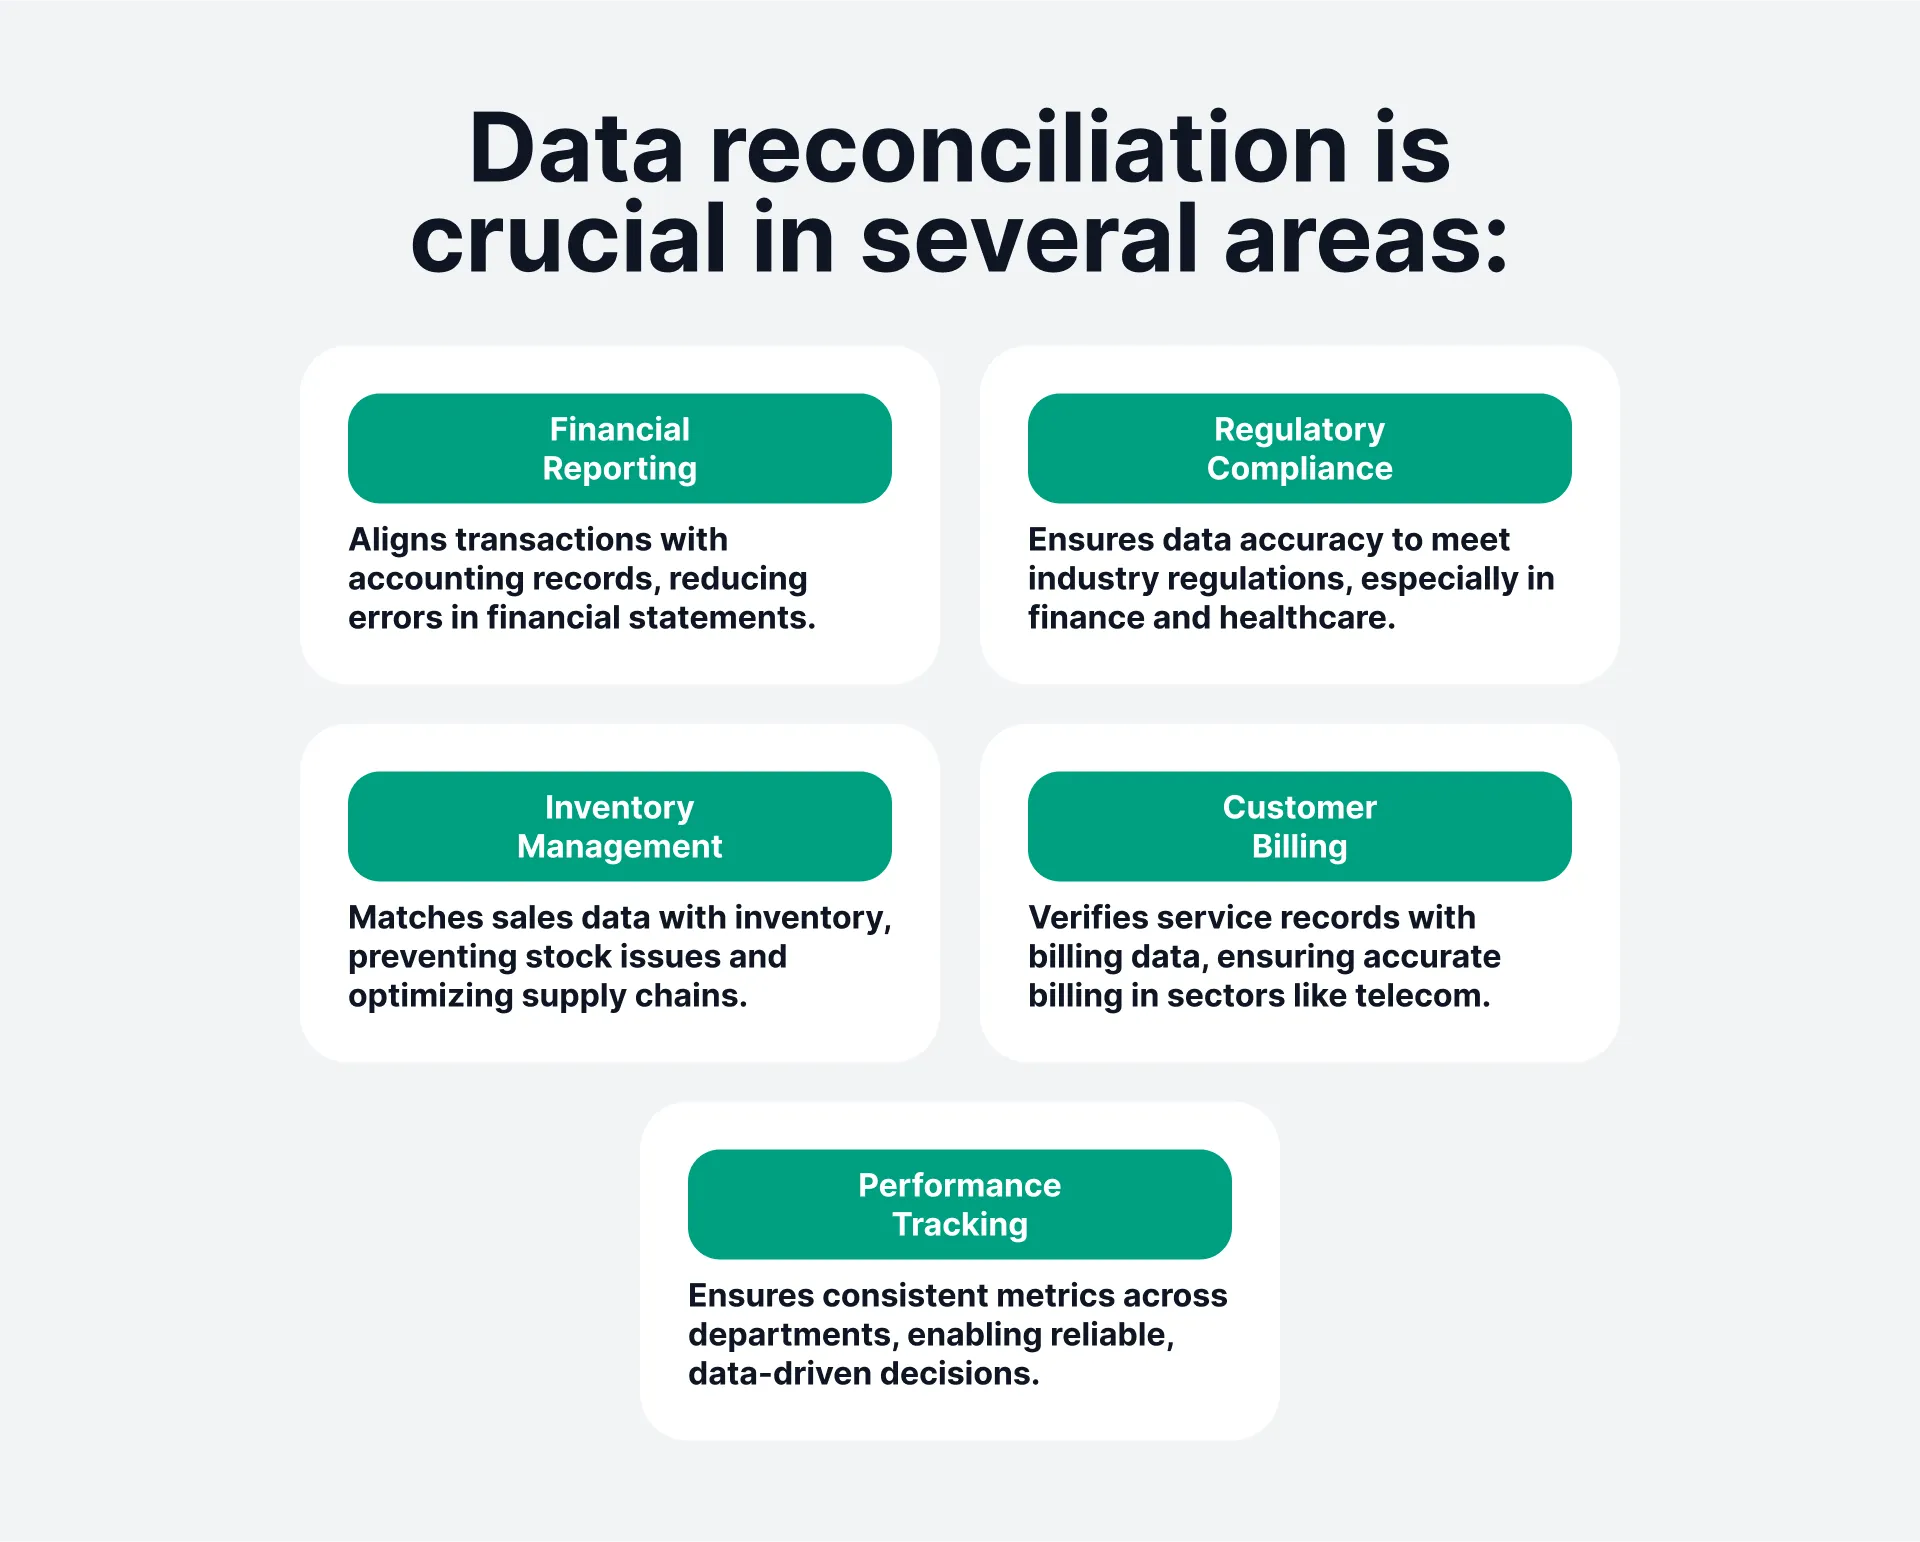
For example, data reconciliation might involve:
- Financial Services: Matching bank statements with accounting records to prevent errors and ensure regulatory compliance.
- Healthcare: Aligning patient records across various systems to provide continuity of care.
- Telecommunications: Reconciling call records with billing systems to ensure accurate customer billing.
- Manufacturing: Ensuring production data aligns with inventory records to monitor resource usage and manage costs efficiently.
The Three Things People Mean By It
Before going further it is worth separating three jobs that share the name, because a good deal of confusion in reconciliation projects comes from two people using the word for different work and not noticing.
| Kind | What gets compared | What "reconciled" means |
|---|---|---|
| Financial reconciliation | Balances and transactions between a ledger and a bank statement, a subsidiary system, or another entity's books | Every difference is either eliminated or explained and documented |
| Pipeline reconciliation | A dataset at its source against the same dataset after it has been moved, transformed, or migrated | Row counts, sums, and key sets agree between source and target within an agreed tolerance |
| Master data reconciliation | Records describing the same real-world customer, product, or supplier held in several systems | One agreed record per real-world entity, with the duplicates linked to it |
They also sit with different people and run on different clocks. Financial reconciliation belongs to finance and accounting on a daily or monthly cycle, pipeline reconciliation to data engineering per load or per migration cut-over, and master data reconciliation to data stewards continuously rather than on a cycle.
The distinction matters because the three fail for different reasons and are fixed by different people. A finance team asking for help with reconciliation wants the month to close. An engineering team asking the same question wants to prove a migration did not lose rows. Answering one with the other is how reconciliation projects stall.
What they share is the part nobody owns: agreeing what should have matched in the first place. That is a definitional question, not a technical one, and it is where the rest of this article goes.
How Data Reconciliation Works, Step by Step
Whichever kind you are running, the shape is the same five steps.
1. Define what should match, and to what tolerance. This is the step that gets skipped and the step that decides whether the rest works. Are you matching on transaction count, on value, on both? Is a difference of one cent a break or a rounding artifact? Are both sides supposed to contain the same population of records, and if not, which exclusions are legitimate? Write these down before running anything, because deciding them afterwards means deciding them in a way that makes the current numbers look acceptable.
2. Extract both sides at a comparable point in time. Two systems read at different moments will disagree about anything that moved in between, and that difference is not a data quality problem. Fix the cut-off first, or you will spend the exercise investigating your own timing.
3. Match on an agreed key. Where a shared identifier exists this is straightforward. Where it does not, matching falls back to combinations of attributes, and that is the point at which reconciliation quietly becomes a modelling exercise, with all the judgement calls that implies.
4. Classify what did not match. Not all breaks are equal, and treating them as one pile is why reconciliation feels endless. Timing breaks resolve themselves next cycle. Structural breaks mean a transformation is dropping or duplicating records. Definitional breaks mean the two systems were never counting the same thing. Only the first is harmless.
5. Resolve, and record the cause. The resolution is the visible work. Recording why it happened is the work that pays, because a break with a documented cause can be prevented, and a break that is only ever corrected will arrive again next month looking exactly the same.
That fourth category is the one worth dwelling on. A definitional break is not a data problem at all. It is two teams having agreed to different meanings and finding out downstream, and no amount of matching logic resolves it, because the systems are both correct about different questions. That is the bridge to everything below.
The Role of Data Governance in Reconciliation
Data governance provides the framework necessary to standardize and streamline data reconciliation, introducing consistency through defined rules, structures, and accountability. This framework supports data reconciliation efforts by reducing ambiguity and enhancing accuracy. When data governance is applied effectively, it enforces standards for data quality, validation, and usage, making it easier to resolve discrepancies and align data across systems.
A crucial part of this framework is a shared data dictionary, or catalog, which acts as a common language across departments. This tool allows experts from different areas, whether finance, sales, or risk management, not only to work with data but to collaborate in defining it accurately and ensuring everyone interprets it consistently. When teams align on clear definitions and terminology, they create a unified understanding of key data attributes, metrics, and processes. This shared understanding is essential for transparent communication and makes reconciliation a far smoother, less error-prone process, as each department can rely on the same "translation" of data concepts.
In regulated reporting this stops being a matter of convenience. The Basel Committee's Principles for effective risk data aggregation and risk reporting are built on the expectation that an institution can bring its risk data together and show that the reported figures hold up. A firm that cannot demonstrate its systems agree cannot demonstrate its report is accurate, and reconciliation is how that agreement gets evidenced.
A Data Catalog as a Translator: Creating a Common Language for Data
A data catalog is more than a metadata repository; it's a communication tool that helps organizations align their understanding and use of data across departments. Imagine that within a company, finance speaks "Spanish" and sales speaks "German." Without a shared glossary, misunderstandings can arise, even though everyone appears to be discussing the same topic. The data catalog acts as a "translation dictionary," making it possible to document terms like "revenue" or "profit" with precise, consistent definitions that everyone understands.
For example, in a telecom company, the term "customer" may mean different things to different departments. For the legal team, a customer is anyone with a contract; for finance, it's someone who has spent at least 1 Kč; and for the technical team, it's any individual who has transferred at least 1KB of data.
That example is worth reading twice, because it is a definitional break waiting to happen. Three systems will report three different customer counts, all of them correct, and every month somebody will reconcile them and find a difference that no matching rule can close. The business glossary is where that gets settled once instead of investigated repeatedly.
A data catalog, maintained and defined by data stewards, allows both finance and sales to align their interpretations, ensuring they work with the same data definitions and reducing misunderstandings. This alignment forms the basis of "speaking one language" across the organization.
A Real-World Scenario: Ensuring Data Consistency through Collaboration
Consider a business that sells steel. Each department has different data requirements and responsibilities:
- Sales: Tracks the volume of steel sold in tons, focusing on sales metrics relevant to their KPIs.
- Finance: Adds the pricing and cost details, calculating net profit by subtracting costs from revenue.
- Risk Management: Adds a risk coefficient, adjusting expectations based on client payment history.
- Technical: Manages product-specific details, such as steel grades and specifications.
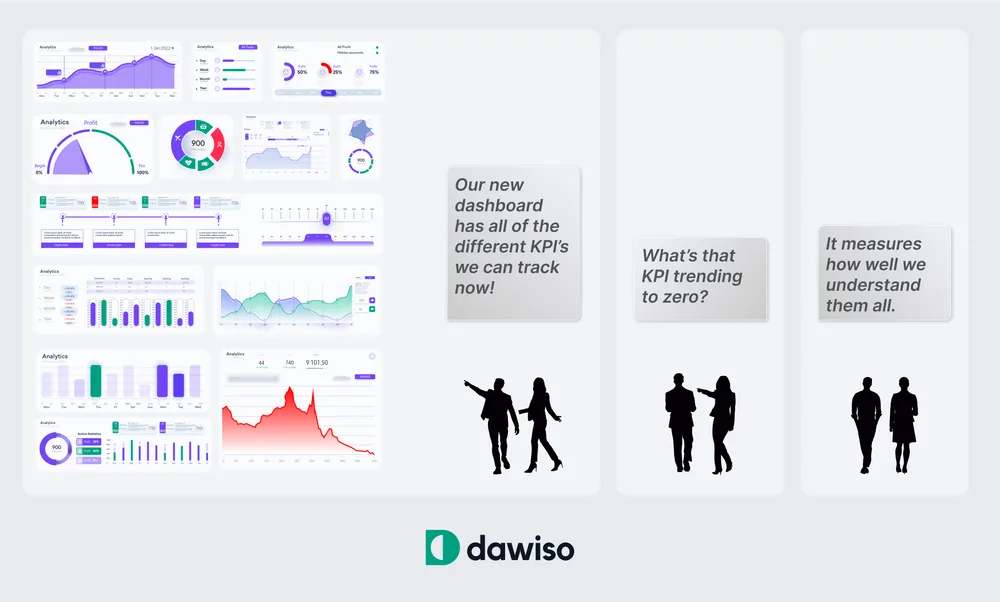
Each team contributes its portion to the data landscape, but without a central repository like a data catalog, their interpretations and KPIs might not align. Through the data catalog, each team can see how their data attributes are defined and connected to broader metrics, allowing them to work in sync. The finance department, for example, needs sales input on quantities and risk input on payment likelihood to project actual profit. Meanwhile, the sales team gains insight into which definitions drive the financial metrics they are held accountable for, fostering a collaborative and transparent data environment.
Data lineage does the other half of the job here. Once a break is found, lineage is what turns "these two numbers disagree" into "this transformation is where they diverged," which is the difference between an investigation and a fix.
Benefits of Using a Data Catalog for Data Reconciliation
With a data catalog, organizations enjoy several key benefits that enhance data reconciliation efforts:
- Unified Terminology and Definitions: A catalog provides a single, maintained repository of terms and definitions that all departments can access. This standardization allows everyone to work with the same data definitions, reducing ambiguity.
- Improved Communication: By documenting the relationships between data attributes and business definitions, the catalog becomes a bridge between departments. Teams can see how specific metrics or KPIs are calculated, facilitating more informed discussions.
- Enhanced Accountability: Data governance assigns ownership to specific data elements. In the example above, finance owns financial calculations, while sales owns volume metrics, and risk owns risk adjustments. This accountability streamlines the reconciliation process.
- Data Transparency and Trust: By making definitions and data lineage accessible to all, a data catalog fosters trust in data and helps teams confidently base decisions on shared, accurate data.
Conclusion
Data reconciliation, supported by robust data governance, is essential for organizations seeking to maintain accurate, consistent data across systems. The data catalog plays a crucial role in this process, acting as a communication and alignment tool that enables different departments to work with a common understanding of their data. By documenting, defining, and sharing data attributes and terms, businesses can build a foundation of transparency and trust, ultimately enhancing data quality and supporting strategic goals.
The practical test of whether it is working is not how quickly you close a reconciliation. It is whether the same break arrives again next month.
FAQ
What is data reconciliation?
What is the difference between data reconciliation and data validation?
What are the main types of data reconciliation?
How is data reconciliation done?
What causes reconciliation breaks?
Why does data reconciliation matter for compliance?
Sources
- Basel Committee on Banking Supervision - Principles for effective risk data aggregation and risk reporting, January 2013
See it in action
Dawiso Data Catalog
One agreed definition per business term, so the same break stops arriving every month.