Power BI Visual-Level Lineage: Trace Data to Every Table or Chart
Power BI lineage usually stops where it starts getting interesting: at the report level. In this post, I’m going one step deeper—down to the individual visual. The goal is simple: for every table, chart, or card on a report page, identify what data it actually uses. That means mapping each visual back to the semantic model objects it depends on: tables, columns, measures, and sometimes even calculation groups. Once you have that, you can answer real lineage questions like “Which visuals break if I rename this column?” or “Where is this KPI measure displayed across all reports?”
How it looks like
This diagram shows visual-level lineage: the Sales Amount measure in the semantic model is linked to specific visuals (pivot table, card, slicer) in the report, enabling precise impact analysis when model objects change.
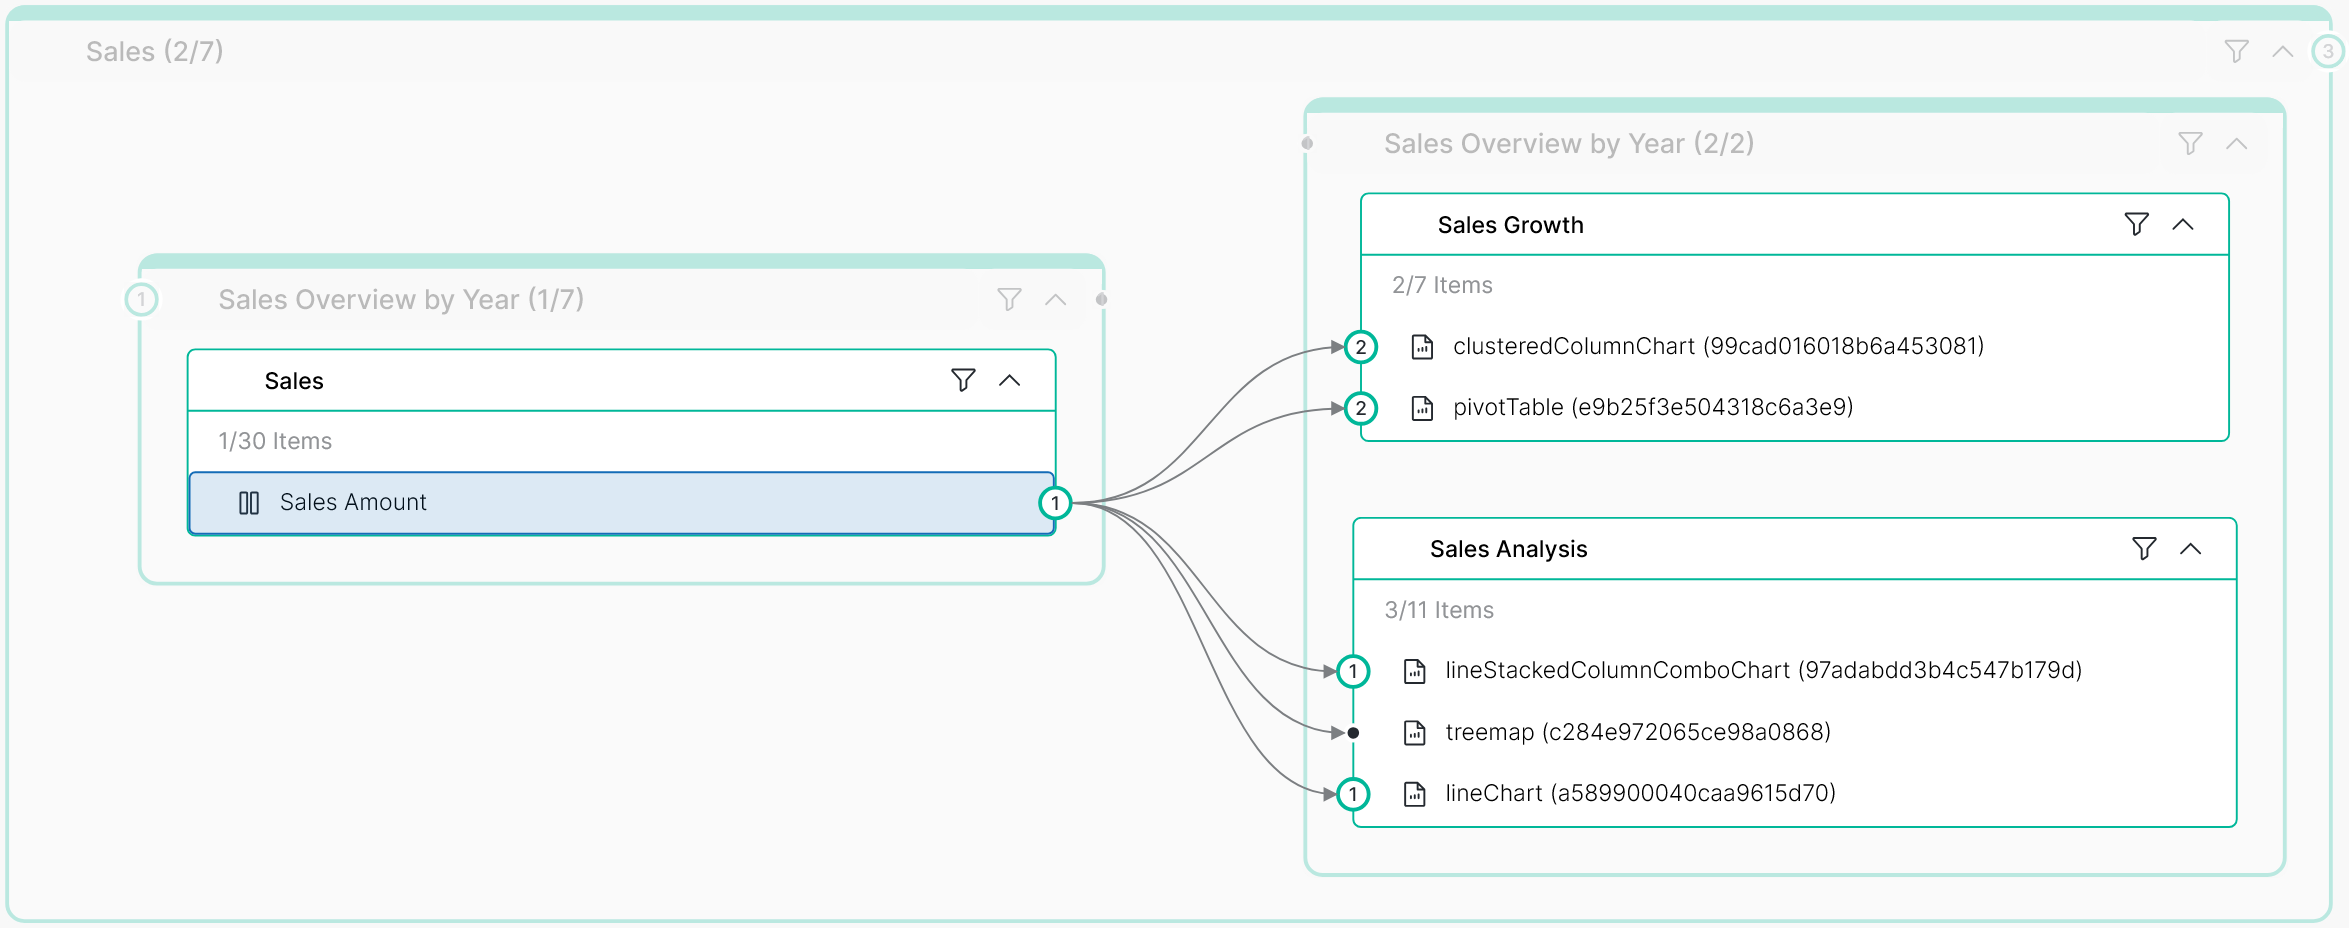
Instead of just seeing that a report uses data from a semantic model (Semantic Model → Report), you get granular visibility into which specific semantic model objects are consumed by which visuals on which pages (Semantic Model Object (fields/measures) → Report =>Page => Visual item).
A single report page becomes a list of visuals such as:
- Card → uses [Sales Amount]
- Slicer → uses DimDate[Year]
- Matrix → uses [Sales Amount], DimProduct[Category], DimDate[Year]
You can open a measure and immediately see all visuals that display it (including where: workspace → report → page → visual) or you can click a visual and see its full dependency list: measures, columns, tables, dataset, and upstream sources (SQL / Lakehouse / etc.).
What is enables
Visual-level lineage is not useful if it ends up as a one-off export. The value comes when lineage becomes searchable and actionable:
Impact analysis workflow
- selecting a column or measure shows all affected visuals across all reports
Governance controls
- flag visuals that use sensitive fields, or reports using non-certified measures
Documentation
- “what this visual means” is backed by real dependencies (not manual descriptions)
AI readiness
- once you have precise lineage edges, natural-language queries like “Where is Sales Amount shown?” or “Which visuals depend on Customer Email?” become straightforward
Data Governace Perspective
From a data-governance perspective, lineage that goes from semantic model tables/columns/measures all the way down to the report visual is where lineage becomes truly actionable. It lets you do real impact analysis: when someone renames a column, changes a measure, or refactors a calculation group, you can immediately see which specific visuals (not just which reports) are affected—so changes become safer and easier to approve. It also uncovers “hidden” dependencies created by visual filters, tooltips, drillthrough, conditional formatting, and interactions that are typically invisible if you stop at the dataset level.
This level of detail improves auditability and trust: you can trace what a business user sees in a card or chart back to the exact governed definition in the model, and prove where sensitive fields are actually used. It helps reduce model sprawl by identifying unused measures/columns and detecting duplicate KPIs that quietly diverged over time. Operationally, it speeds up troubleshooting and performance work because you can prioritize tuning and fixes based on which visuals are most critical and most used. Finally, it makes your catalog far more useful—users can search a KPI and instantly discover every page and visual where it appears, which is also a strong foundation for AI assistants that answer governance questions with precision.